
Is Your Process Capable?
MODELING YOUR SPECIFICATIONS FOR SUCCESS BY UNDERSTANDING YOUR PROCESSES CAPABILITY (Cpk).
The R&D team is fist-bumping, and the Sales and Marketing teams are on board. The sales sheets are printed, and the team is just settling into the booth to make 2023 the best sales year ever for your new products. It couldn’t be better; everything was moving toward your projections, and there is a lot of excitement toward the new launch. You are encouraged by the test market data that the new products should sell well and, so far, they are. The stakeholders will be pleased by your results, you ponder.
Meanwhile, back at the manufacturing facility, the phones ringing off the hook. The QA manager has just about set up a permanent camp in the operations manager’s office and both are quite verbally cursing the R&D team. They pace back and forth, pulling out all their tools in their toolbox; fishbone diagrams, 5 whys, trying to figure out why they can’t run these new products to any level of success. Their yields are low, throughput is terrible, and rework over time is off the charts. What’s happening? Why did the trial runs go well only to have multiple problems after the trials?
One possible explanation could be that the specification was never capable of running on the current process. But you ask, how did they have a successful trial when working with R&D, what changed? It may be that nothing changed. It may be that the process is just the process and the results on the given day of the trial runs were not representative of the true nature of the process. Or another way to put it is, during the trial runs, key variances were not captured by the R&D team.
I have worked on hundreds of new products in cooperation with various R&D teams throughout my time in industry and often the design of experiments has left off various key factors ensuring the variance of a process is captured during trials. These factors could include things often overlooked, like sample ingredients versus bulk ingredients, room conditions (humidity, temperature, etc., especially for dry products), single batch priming versus live run priming, seasonal ingredient variance, process set-up changes, parts/machine wear, or even different employees (turnover).
With any specification, there are many attributes that determine the product's overall functionality, quality, and appearance. Trust in a product’s food safety and performance are almost given to a brand by its customers on blind trust as they do not possess the means to test that the product labeling does what it claims. For instance, if you buy a bottle of extra strength Tylenol® and it says 325 mg of Acetaminophen per capsule, no one actually tests the Tylenol® to see if each capsule does contain 325 mg of Acetaminophen. Likewise, with food products in general, not many consumers will test a diet to see if it contains what the label says it does. So, the consumers have blind trust in those categories. However, what they can grasp are differences. People, by nature, constantly apply different engines to every evaluation we make. Any consumer that buys a brand consistently can pick up on those attributes that they can see, feel, smell, and change in their pets’ acceptability habits. They, likewise, can innately perceive the “norm” of the product they buy and determine when something seems wrong. So, ninety (90) percent of the complaints received are generally around quality issues; appearance, smell, the pet won’t eat, packaging issues, and size/shape. It only stands to reason that, if we want to drive customer satisfaction in the hopes of brand loyalty and repeat sales, we need to spend a great deal of time and effort building into the specification of product consistency. Through product consistency, i.e., perceived quality, we will be able to do so only when the product specification and the process capabilities are aligned.
The next question is whether we can we predict our specification's success or failure. Can we measure it? The answer: you bet! One of the most valuable tools in a Quality Manager’s toolbox is the use of a statistic called Process Capability Analysis or, in statistical terms, Cpk. Process Capability Analysis is helpful to plant and quality operations in several ways: it is useful as a pictorial, to show the variance within the process and general distribution, as a predictor of success or failure of the process as a result of that natural variation and can help identify root causes that may lead to a variation of a process that is not centered around the desired specification. Process capability analysis should give you metrics that you can trend to determine if your process is becoming more or less capable. Upon performing the statistic, results for compliance are usually shared as percent within or out of specification limits, or as defects per million units, and indices are referenced in the Cpk stat. A competent process has a Cpk statistic of 1.33 or greater, which would indicate only 64 defects per million units. This is also considered a 4-sigma process.
Process capability analysis can be performed for any attribute that can be measured and when you have determined specification boundaries around that attribute, an upper and lower specification limit or have at least one limit (Min. or Max). Typical attributes that are measured for capability are physical – length, width, height, temperatures, densities, viscosities, weight, etc., some chemical – moisture, fat, protein, bone (ash), etc. and even some microbiological – aerobic plate counts on incoming meat samples, etc. Even color and aroma can be measured if you convert subjective data to objective data and score them. Tools for this might be gauges, color charts, or cutting calibrations. You see this often with meat judging, wine judging, or coffee tasting.
Many tools are commercially available, all lending different looks of output and the overall power of the statistics. Excel from Microsoft can be used and programmed to perform capability analysis; however, the standard stat pack does not contain this feature without additional add-ons. Other software suites, such as JMP, SAS, or Minitab, are some of the more popular statistic programs, but there are other less expensive systems available and even some free calculators on the web. So, do some digging and determine what might work best for your company’s interest level.
Just to illustrate the value of using Cpk analysis, I put together some fictitious sample data using Minitab and then performed process Capability Analysis (Normal), where the sample number was 60 random points; one dataset with 1.0 standard deviation of variance and 1 dataset with 2.0 standard deviation of variance. The data represents product length, and the ideal piece length is 15 mm, however, the specification calls for 13mm to 18mm. Consider the two graphs below, and let’s see how they differ to point out process variation.
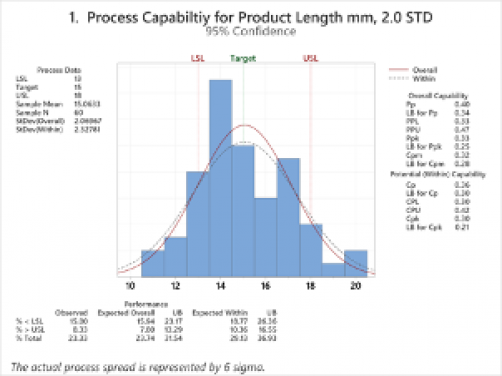
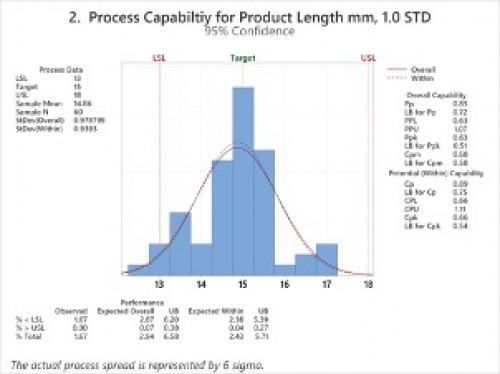
Both Process 1 and Process 2 are normally distributed and exhibit normal variation, and both have a good number of samples for some analysis at 60; however, Process 1 based on our specification limits of 13mm to 18mm for length, is expected to fail or be out of specification 24% of the time. In contrast, Process 2 is expected to fail or be out of specification only 3% of the time. Neither process is capable of meeting specifications 100% of the time. Still, Process 1 is going to significantly inhibit your yield and rework and success of the launch, where Process 2 is most likely to be acceptable rework or losses to your company and be reasonably successful with your consumers over time.
From this analysis, you have some different choices for Process 1:
- Drop the line and go back to the drawing board. This time designing in data capture that will highlight any process variance (very costly).
- Raise prices to offset your yield and rework losses (may lose customers).
- You could just adjust your specification to be much bigger, say 10mm to 20mm, and determine if this variation is acceptable to the customer and doesn’t create other issues as a result, like weight in bag challenges.
- You can look at the differences between Process 1 and Process 2 and discover what is different and gain an understanding of best practices from Process 2. Here’s where your root cause analysis tools can kick in, and you can start identifying and eliminating variation in your process.
- Or you could run additional sampling and analysis to determine what attributes contribute most to the overall variance and then determine how to control those factors.
I started this blog with a bit of fun regarding new product launches but, unfortunately, these scenarios are far too often true. If, during your R&D phase of product design and commissioning, we had built in some process capability analysis into our tests, we may have been able to understand that the variation in Process 1 is way too much to deliver the Sales and Marketing team the product they want to sell. During that phase, we could have identified the sources of variation and removed or corrected them so the operations group could deliver consistent product in specification at an acceptable yield and, at the very least, could have kept the Quality Assurance Manager from quitting due to handling all of the customer complaints.
Key Take Aways:
- Customers will relate quality by what they can perceive and how consistent the product is between purchases. This includes attributes that can be seen, felt, or smelt.
- Sales and Marketing should do their best homework to determine what customers want when it comes to perceived attributes so they can relay a clear picture to the R&D or product innovation teams.
- Take time in your design of experiments to capture key data when it comes to perceived attributes. Plan your trials with enough product to capture as much variation in the process as possible. Multiple batches or half runs can prove helpful here.
- Remember, Process Capability Analysis is one of the best tools a Quality Assurance Manager can have in their toolbox to predict the success or failure of a potential specification.
- Develop your specification both from a customer perspective and a plant variation perspective. Use learnings from the data collected to either root out variation or make appropriate adjustments to help promote the overall success of the product.
- Finding the root cause of variation is not always easy. Don’t be afraid to take it on in smaller chunks and collect data from multiple points in the process to understand the big-picture effect. There are external resources like BSM Assurance who can help with root cause analysis and determining where and how much to measure.
Next Time: Fish in pet food. In keeping with national fish week, I hope to discuss regulations and regulatory impact regarding fish and how the fisheries are also a key supplier to the pet food industry.
Follow us on LinkedIn for the latest updates on all things happening here at BSM Partners.
About the Author
August Konie has been a Food Safety, Quality and Regulatory Professional for over 30 years. He was worked in many sectors of the food industry including fisheries, beverages, poultry, pork and pet food, under both FDA and USDA regulatory oversight. As an active committee member in various trade organization for food and pet food organizations, he was successful of implementing new regulatory guidance. He has worked with various teams across Asian, Europe, North and South American on various food safety, quality and import/export concerns. He currently serves as the Principal of BSM Assurance overseeing FSQAR activities at BSM Partners.
This content is the property of BSM Partners. Reproduction or retransmission or repurposing of any portion of this content is expressly prohibited without the approval of BSM Partners and is governed by the terms and conditions explained here.